The C3.ai COVID-19 Grand Challenge
This project was a submission for the C3.ai COVID-19 Grand Challenge competition hosted during September – December 2020. The project required us to use at least 2 data sources from C3.ai’s COVID-19 Data Lake to create a data science project whose implementations can be used to combat the effects of COVID-19.
Team name: Island Hamstar
Members: Niti Wattanasirichaigoon, Napat Ratanakul, Apiwat Jaroonpol
The code submission can be found at this repository.
Problem Statement
The COVID-19 pandemic affects people’s lives around the world in many aspects. To alleviate the damage, governments issue various policies to help slow down the infection rates or help its people recover from the economic crisis. These policies, however, are usually evaluated qualitatively rather than quantitatively. Obviously, different policies have different goals and each of them can have different impacts to the people and economy, making the direct evaluation of policies difficult.
Thus, our team decided to take a more quantitative approach towards our policy analysis by introducing the concept of the impact scores which can be used to evaluate the impact that a policy has on any given trend.
Methodology
Our approach can be broken down into 4 major steps. The study was conducted upon a list of 34 major countries.
1. Policy Selection
Many governments issued multiple policies to alleviate the effects of COVID-19, some of which are stricter than others, so we narrowed our scope down to 9 types of policies that we are interested in. Since some policies may be updated multiple times to adjust for the country’s situation, we chose the representative policy start date of each type by following the below rubric:
• C1 (School closing): The first policy where all schools in the nation are closed.
• C2 (Workplace closing): The first policy where all non-essential places are closed.
• C3 (Cancel public events): Any nationwide cancellation of public events.
• C4 (Restrictions on gatherings): The policy with least number of people allowed to gather.
• C5 (Close public transport): The most extreme limitation of public transport (if any)
• C6 (Stay at home requirements): The most extreme stay at home orders.
• C7 (Restrictions on internal movement): Any nationwide limitation to travel.
• E1 (Income support): The first government subsidy.
• E2 (Debt/contract relief): The first government debt/contract relief policy.
By the end of this step, we have a cleaned dataset of policies with the country’s name and issued date.
2. Data Preparation
Using the C3.ai API, we prepared the cases dataset from John Hopkins COVID-19 data repository and mobility from Google COVID-19 Community Mobility Reports from mid-February to the end of October 2020. The stocks prices data was gathered from the Wall Street Journal and contains the daily closing prices of each country’s major stock index.
3. Model Design and Coding
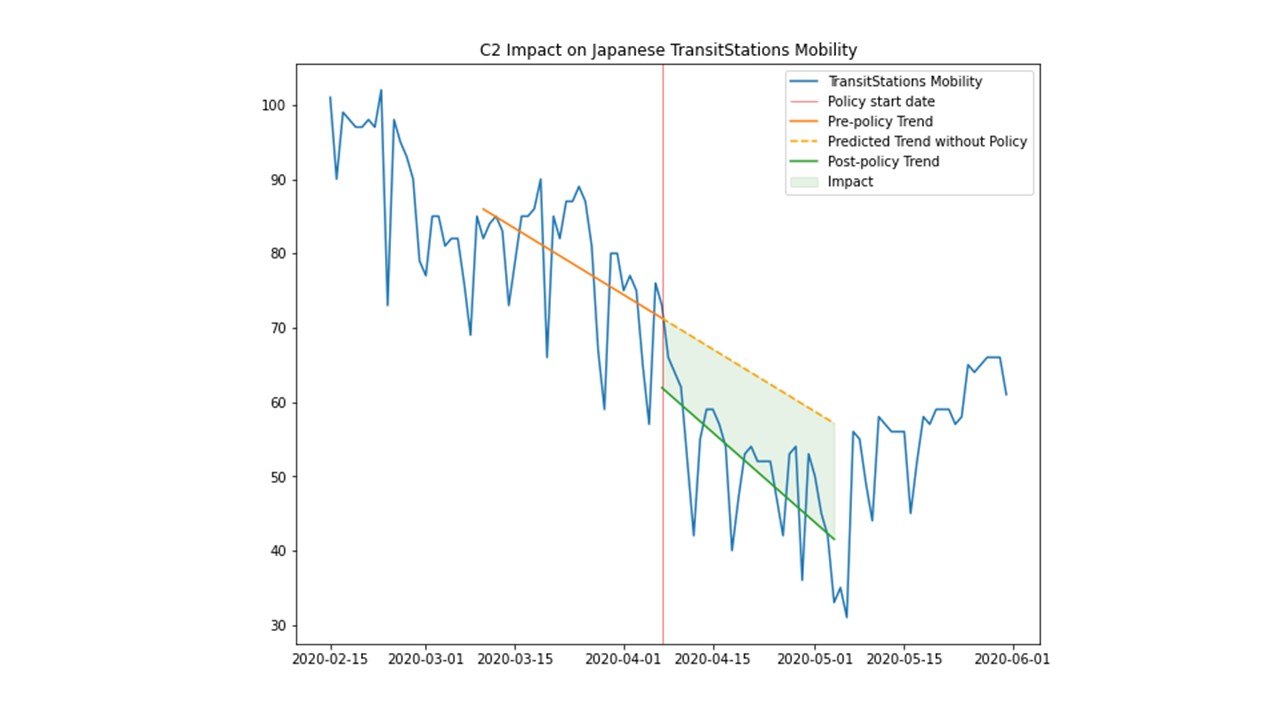
The idea behind our model is to find a method of measuring how a policy affects a certain trend. We first define the pre-policy and post-policy windows as the number of days before and after a policy has been issued. The pre- and post-policy trend lines are computed using the data from their respective windows, yielding us a piecewise linear regression model with the policy’s start date located at the split.
Assume, theoretically, that if a policy were not issued then the current pre-policy trend would continue onwards. Thus, a policy would have impact if there were a significant difference between the pre- and post-policy trends and does not have any impact if both trends appear to be similar. We define the impact as the area between the two trends to incorporate both the slope and intercept of the two trend lines into calculation (a small area between them would imply that the trends are closer together).
The figure below displays how Japan’s C2 (workplace closing) policy affects the trend in transit stations mobility. Our concept of impact is represented
as the shaded region between the pre- and post-policy trend lines. We then divide it by the total area under the predicted trend to get the relative
‘impact score’.
4. Analysis of Results
We then used our method to calculate the impact scores of all the policies in our list, then created boxplots to visualize the impacts different policies have on the infection rate, stock prices, and mobility.
Results
We calculated the impact score of all the policies in our list and visualized the distributions by their types using boxplots.
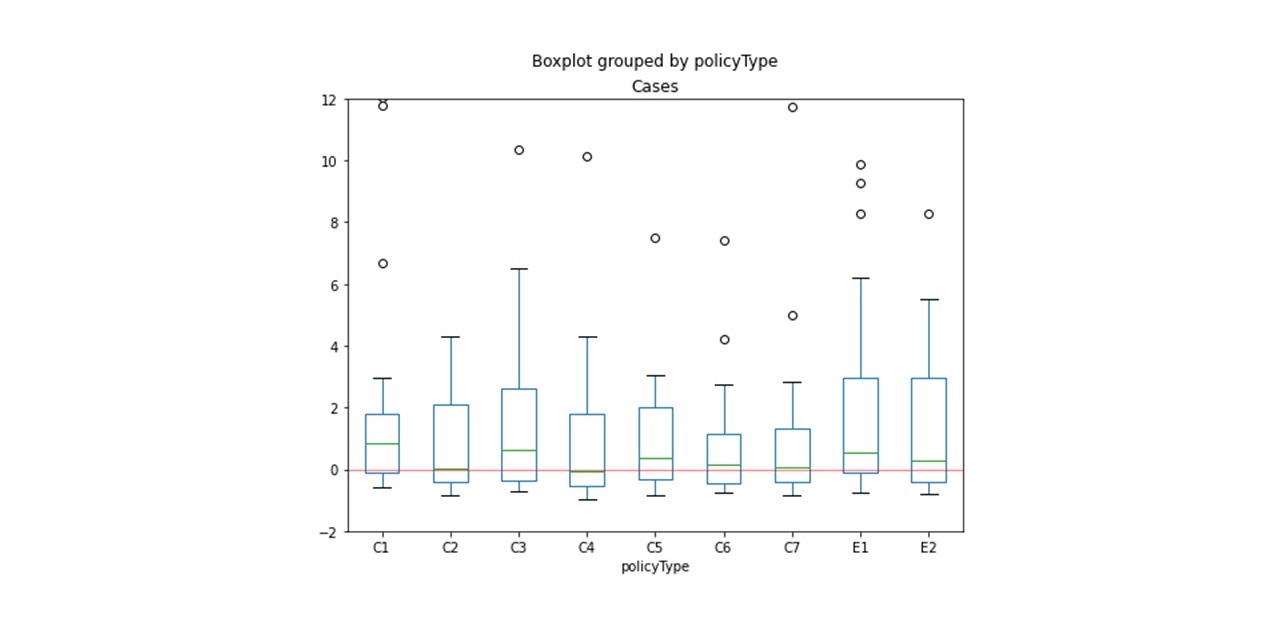
New Cases
Unfortunately, none of the policies seem to have a positive impact on the infection rate. This however, might be a result of improper window size selection
(we used a pre- and post-policy window of 28 days). Further research is required to find the proper window size.
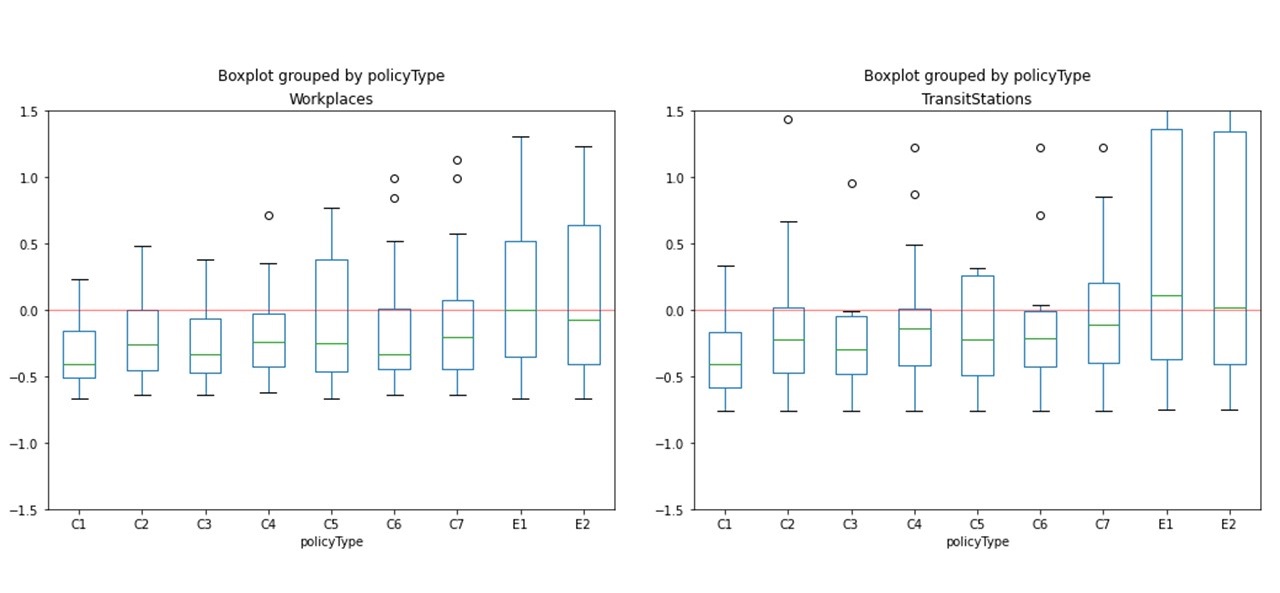
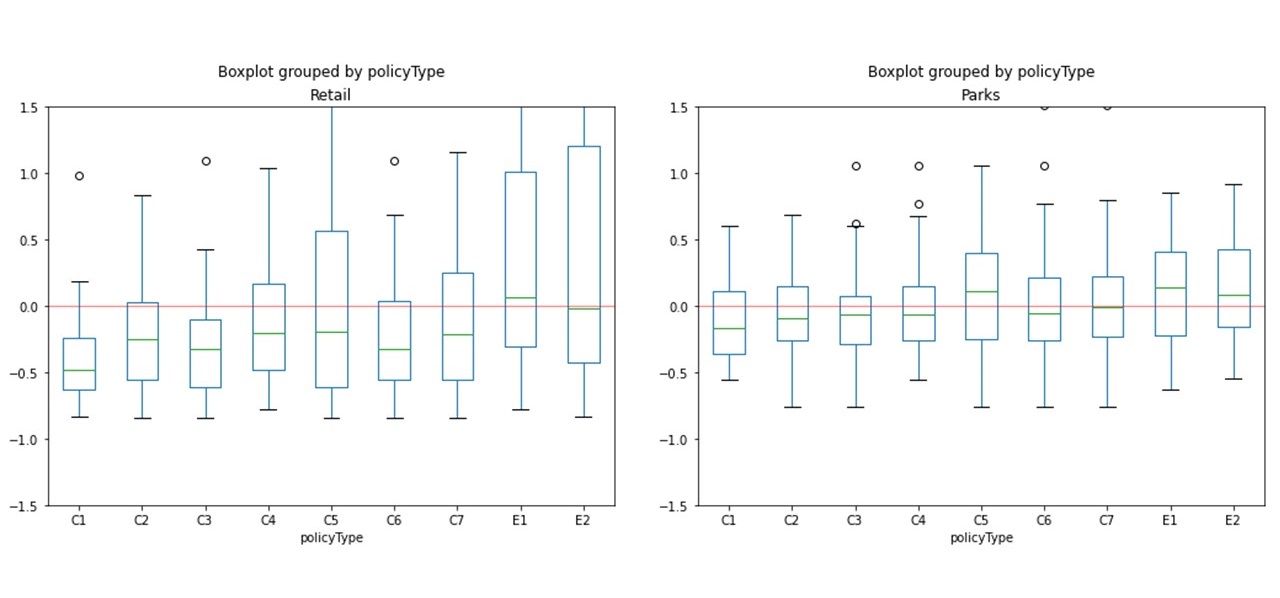
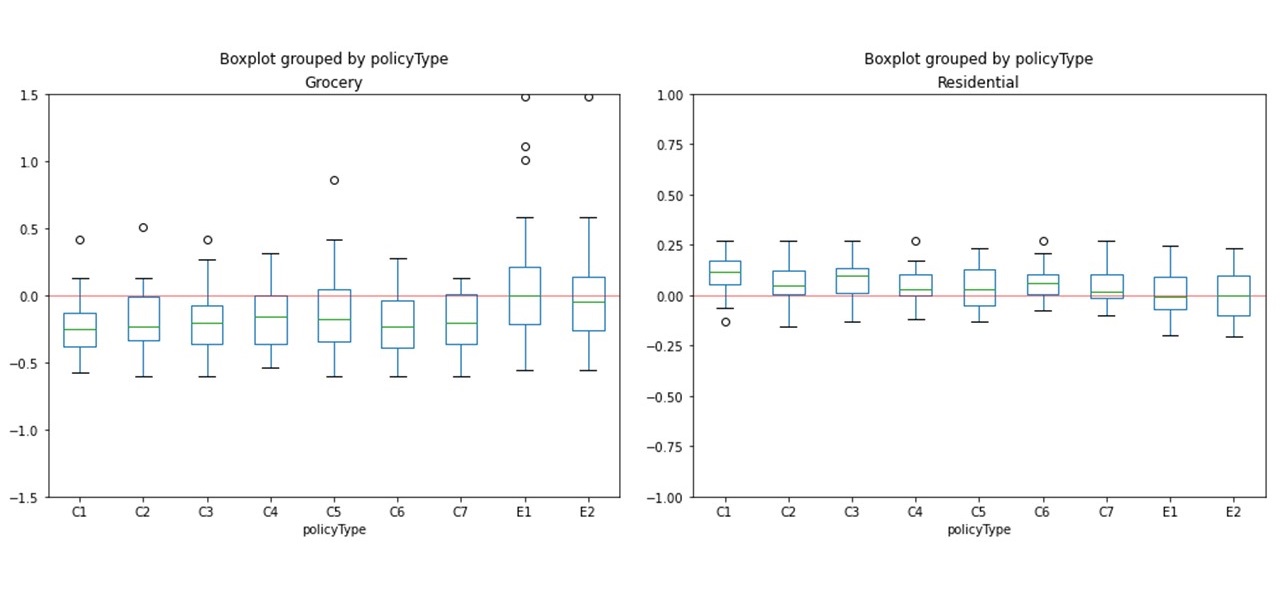
Mobility
The box plot of policy impact scores against mobility shows that restrictive policies (C1-C7) cause negative impact to the trends of public areas such as workplace mobility compared to the baseline mobility before the pandemic while causing positive impact to the trends of residential mobility. This corresponds with our intuition on how the movement restriction policies affect mobility, less people move around workplaces and more move around residential areas.
In contrast, the economic support policies (E1, E2) have no significant impact to the trends of both the public areas and residential mobility. This makes
sense since policies related to subsidies and loans should not directly affect the movement behavior of people.
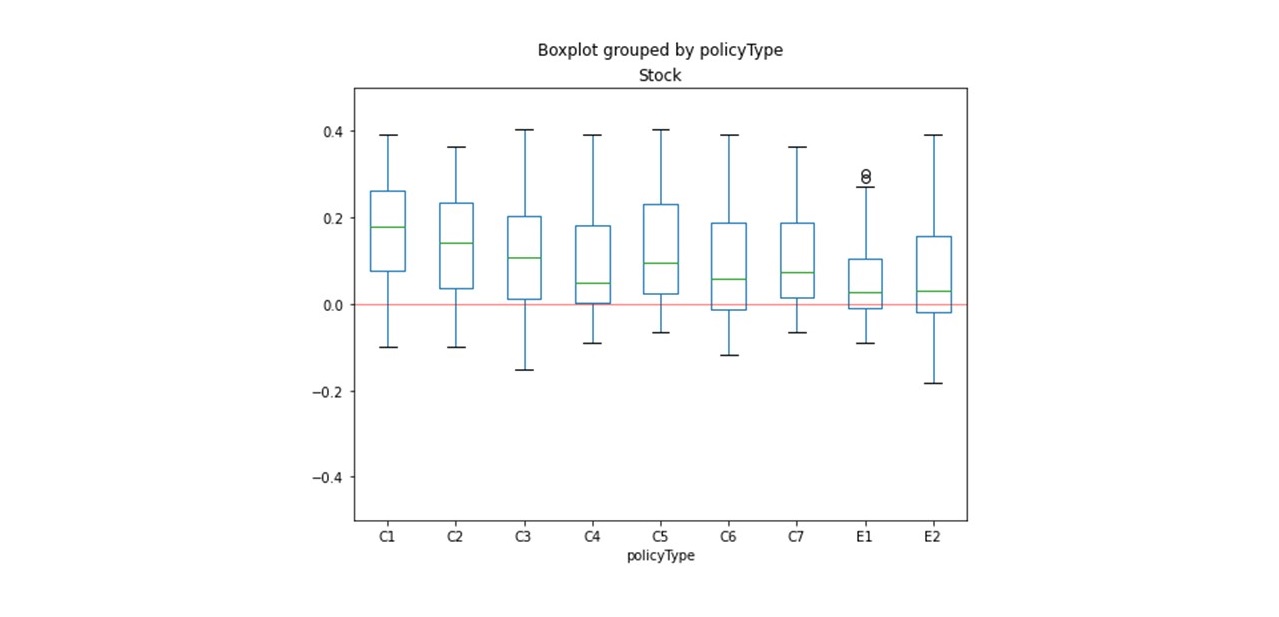
Stock Prices
All policies have a positive impact on the stock prices. This may result from the increase in investors’ trust towards the government as they see more countermeasures are being taken.
Conclusion
Our project introduced a new concept of impact scores which can evaluate government policy in a more standardized and quantitative manner. We also evaluate policies through the relative changes in the trends of various parameters which could provide better understanding of the pandemic situation in each country and enable the government to act more efficiently. This method could also be applied to evaluate the impact of any event that causes the shift in trends of any variable, it could be a foundation towards a new evaluation system and trend analysis.
Potential Improvements
Our project still has unsolved problems that we were not able to address at the time of submission.
Impact Score is Relative
We are measuring the impact on trends based on their predictive value. In some cases, the predictive value might be negative (when the pre-policy trend is decreasing and has a value close to zero), making the impact score invalid.
The Ideal Pre- and Post-Policy Window Sizes are Unknown
We hard coded the pre- and post- policy windows based on the type of variable we were observing. We used a 28-day window for the infection rate and mobility, while using a 7-day window for stock prices. This was purely based on how long we thought we would have to wait to see an observable impact on the trend. This remains a hyperparameter that would require more research to find the ideal window size for each variable.
Policy Synergy
Some countries issue multiple policies at the same time, for example, a country’s lockdown policy can include both gathering restrictions and a curfew. Multiple policies can work together to strengthen the effect observed in shifting trends. Thus, we cannot isolate the effects of each policy nor truly know how much impact each policy is contributing to the trend.
We’d like to thank C3.ai for hosting this competition as we really enjoyed working on this project and learned a lot as a team. Hopefully, our project will be able to help those who are planning policies against COVID-19, or inspire scholars who are researching different methods for trend analysis.